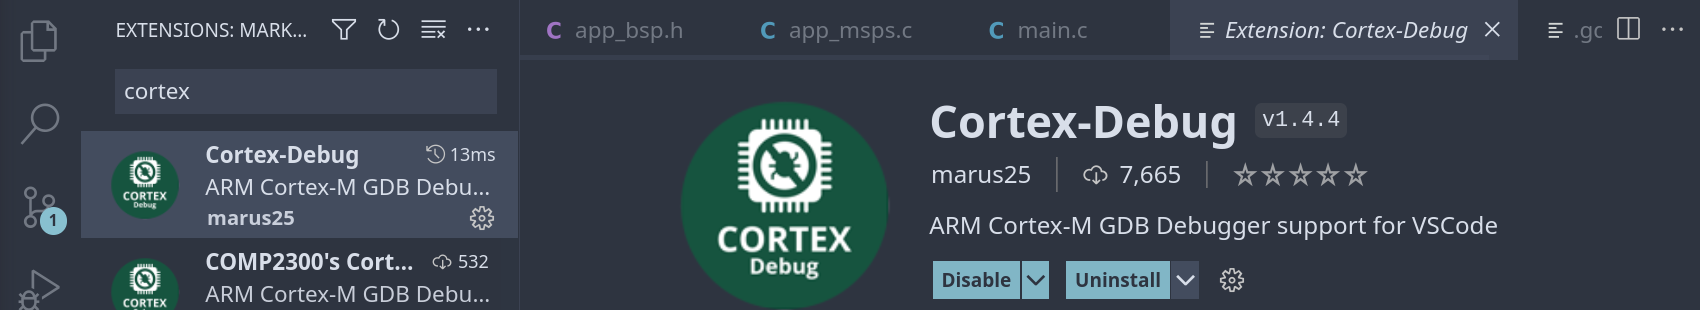
Debugging on a command line can be a daunting task, but the good news are there is a VS Code extension that will allow us to debug in a visual way. Install the plugin Cortex-Debug
Crete a file launch.json inside folder .vscode
$ code .vscode/launch.json Now write the following inside the file
{
"version": "0.2.0",
"configurations": [
{
"type": "cortex-debug",
"request": "launch",
"name": "Debug (OpenOCD)",
"servertype": "openocd",
"interface": "swd",
"cwd": "${workspaceRoot}",
"runToEntryPoint": "main",
"executable": "${workspaceRoot}/Build/temp.elf",
"device": "STM32G0B1RE",
"configFiles": [
"board/st_nucleo_g0.cfg"
],
"svdFile": "${workspaceRoot}/STM32G0B1.svd",
"serverpath": "/usr/bin/openocd",
"armToolchainPath": "/usr/bin",
"showDevDebugOutput": "none"
}
]
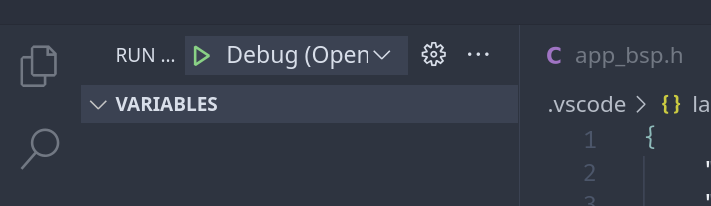
}To launch a debug session just click Ctrl + Shift + d and then click on the green triangle, this launch OpenOCD plus the GDB and use the VS Code as a front end
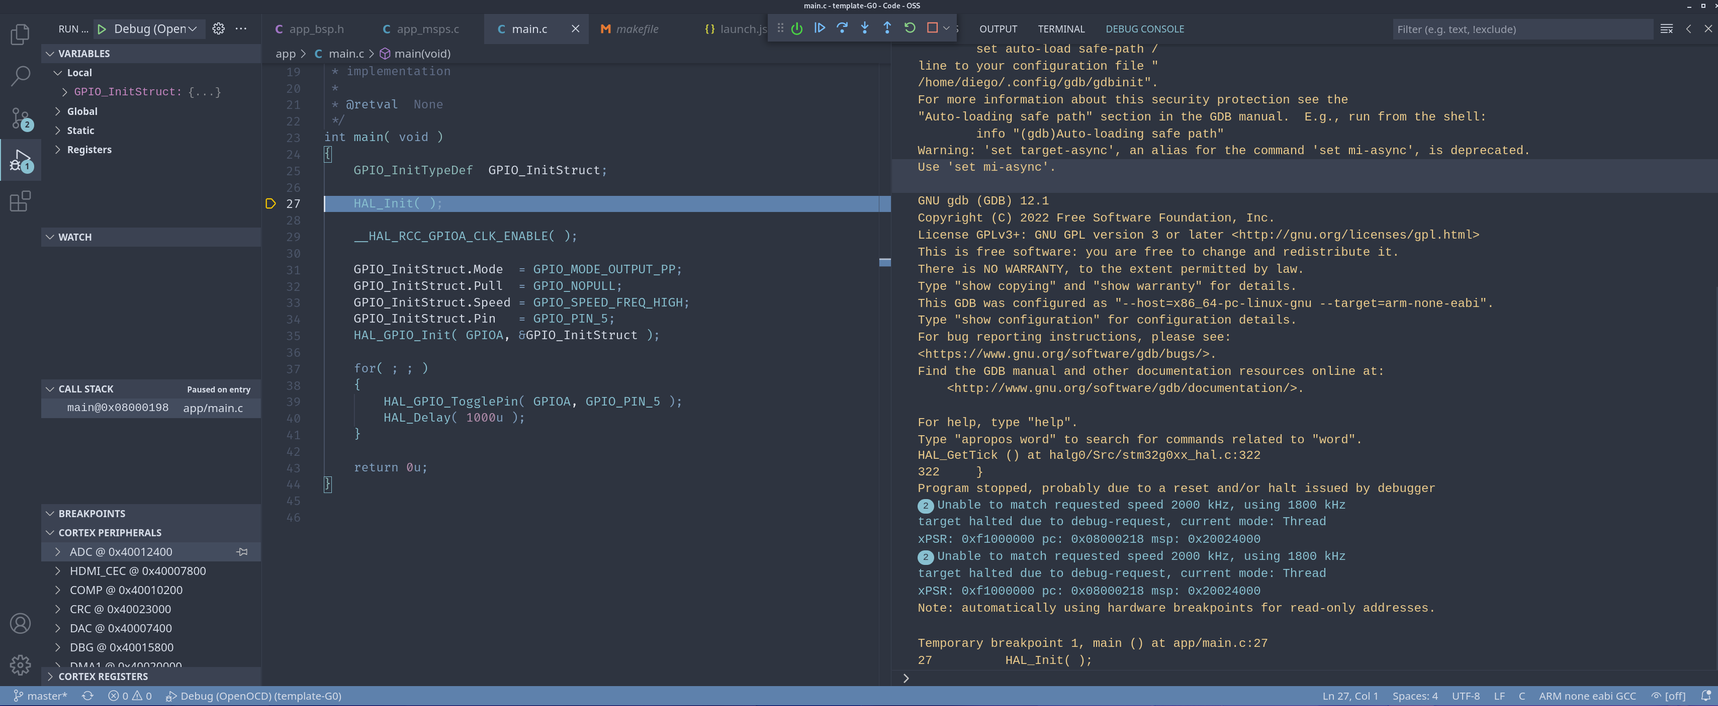
In this view we can control the debug session with the upper controls and if you click on the line number you can insert/delete a break point. On the left side we can visualize variables, break points, stack, peripheral registers and CPU registers. If you want to type GDB commands you can do it on the bottom side of the terminal.
- Continue / Pause F5
- Step Over F10.-
- Step Into F11
- Step Out Shift+F11
- Restart Ctrl+Shift+F5
- Stop Shift+F5
Settings
Ok, i think is important to explain some of the options you possible will need to chage/adapt. Like the name of the binary file to flash in the microcontroller, if you are using our template-g0 in linux you do not need to change anything at least you change the target name
"executable": "${workspaceRoot}/Build/temp.elf",If for some reason you are using a different nucleo board, or any other board from a different vendor supported by OpenOCD, you should change it in here
"device": "STM32G0B1RE",
  "configFiles": [
  "board/st_nucleo_g0.cfg"
],
Update the SVD file. This file contains the names and description of the microcontroller register, you can look for this file on the vendor webpage ( mostly )
"svdFile": "${workspaceRoot}/STM32G0B1.svd"Update the following files if you decide to install arm gdb and openocd in a different directory
"serverpath": "/usr/bin/openocd",
"armToolchainPath": "/usr/bin",
And, in case of windows for sure you will need to update these paths according to windows notation, for instance
"serverpath": "C:\\tools\\openocd\\bin\\openocd.exe",
"armToolchainPath": "C:\\ProgramData\\chocolatey\\bin",jlink
Last but not least, VSCode debug plugin also support JLink and if that is your debugger here is the json configuration file ( notice only two lines changed )
{
    "version": "0.2.0",
    "configurations": [
        {
            "type": "cortex-debug",
            "request": "launch",
            "name": "Debug (JLink)",
            "servertype": "openocd",
            "interface": "swd",
            "cwd": "${workspaceRoot}",
            "runToEntryPoint": "main",
            "executable": "${workspaceRoot}/Build/temp.elf",
            "device": "STM32G0B1RE",
            "svdFile": "${workspaceRoot}/STM32G0B1.svd",
            "serverpath": "/usr/bin/JLinkGDBServer",
            "armToolchainPath": "/usr/bin",
            "showDevDebugOutput": "none"
        }
    ]
}And... In case you want to use Segger RTT, you can add the following lines after showDevDebugOutput to enable the RTT terminal
          "showDevDebugOutput": "none",
          "rttConfig": {
            "enabled": true,
            "address": "auto",
            "decoders": [
                {
                    "port": 0,
                    "type": "console"
                }
            ]
        }