Eclipse is old and somewhat outdated, at least for me. I know there are still people who really like working with this veteran IDE. In this article, I'm going to show you how to use Eclipse only for debugging purposes. Maybe you don’t like VSCode and therefore can’t use the Cortex-Debug plugin, and if you don’t have a J-Link, then Ozone is out of the equation. Therefore, Eclipse is our answer when debugging beyond the command line is what we're looking for.
Go to the eclipse foundation web page, and Download the Eclipse IDE for Embedded C/C++ Developers version, Linux option of course.

Once downloaded, unzip the file and place the resulting folder wherever you like, but just make sure to remember where you placed it. Inside the newly unzipped Eclipse folder, there is an Eclipse icon. You can run the program by double-clicking on it.
$ tar -xvzf eclipse-embedcpp-2025-03-R-linux-gtk-x86_64.tar.gzLet’s say you download our now-famous template project from this link and start writing your code. After compiling with make, you’re ready to flash your board and debug to find potential errors. Even though you've installed the ARM GNU toolchain, you don’t want to run its debugger using the command line. Well, Eclipse can be used as a graphical front-end, and here’s how.
Import the project
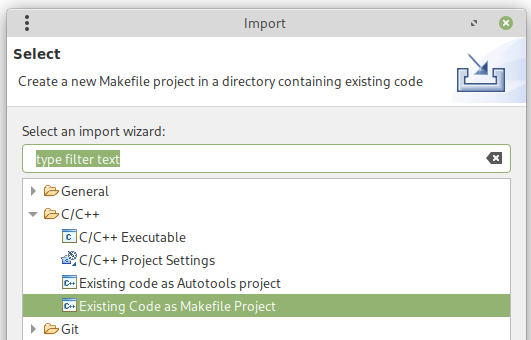
Open eclipse and then go to Menu File → import … on the new window select Existing Code as Makefile Project just like the image below shows
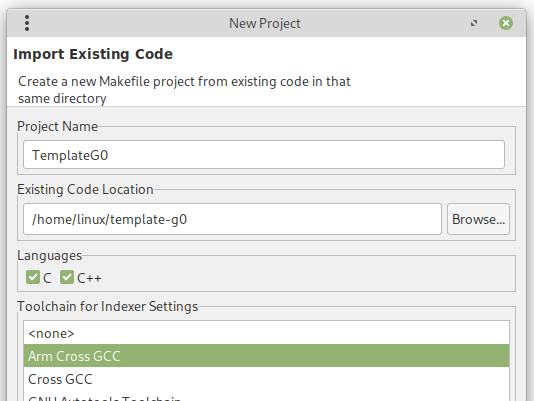
Then click Next, choose a name for your Eclipse project, and using Browse button search for your project directory. Last click on Finish
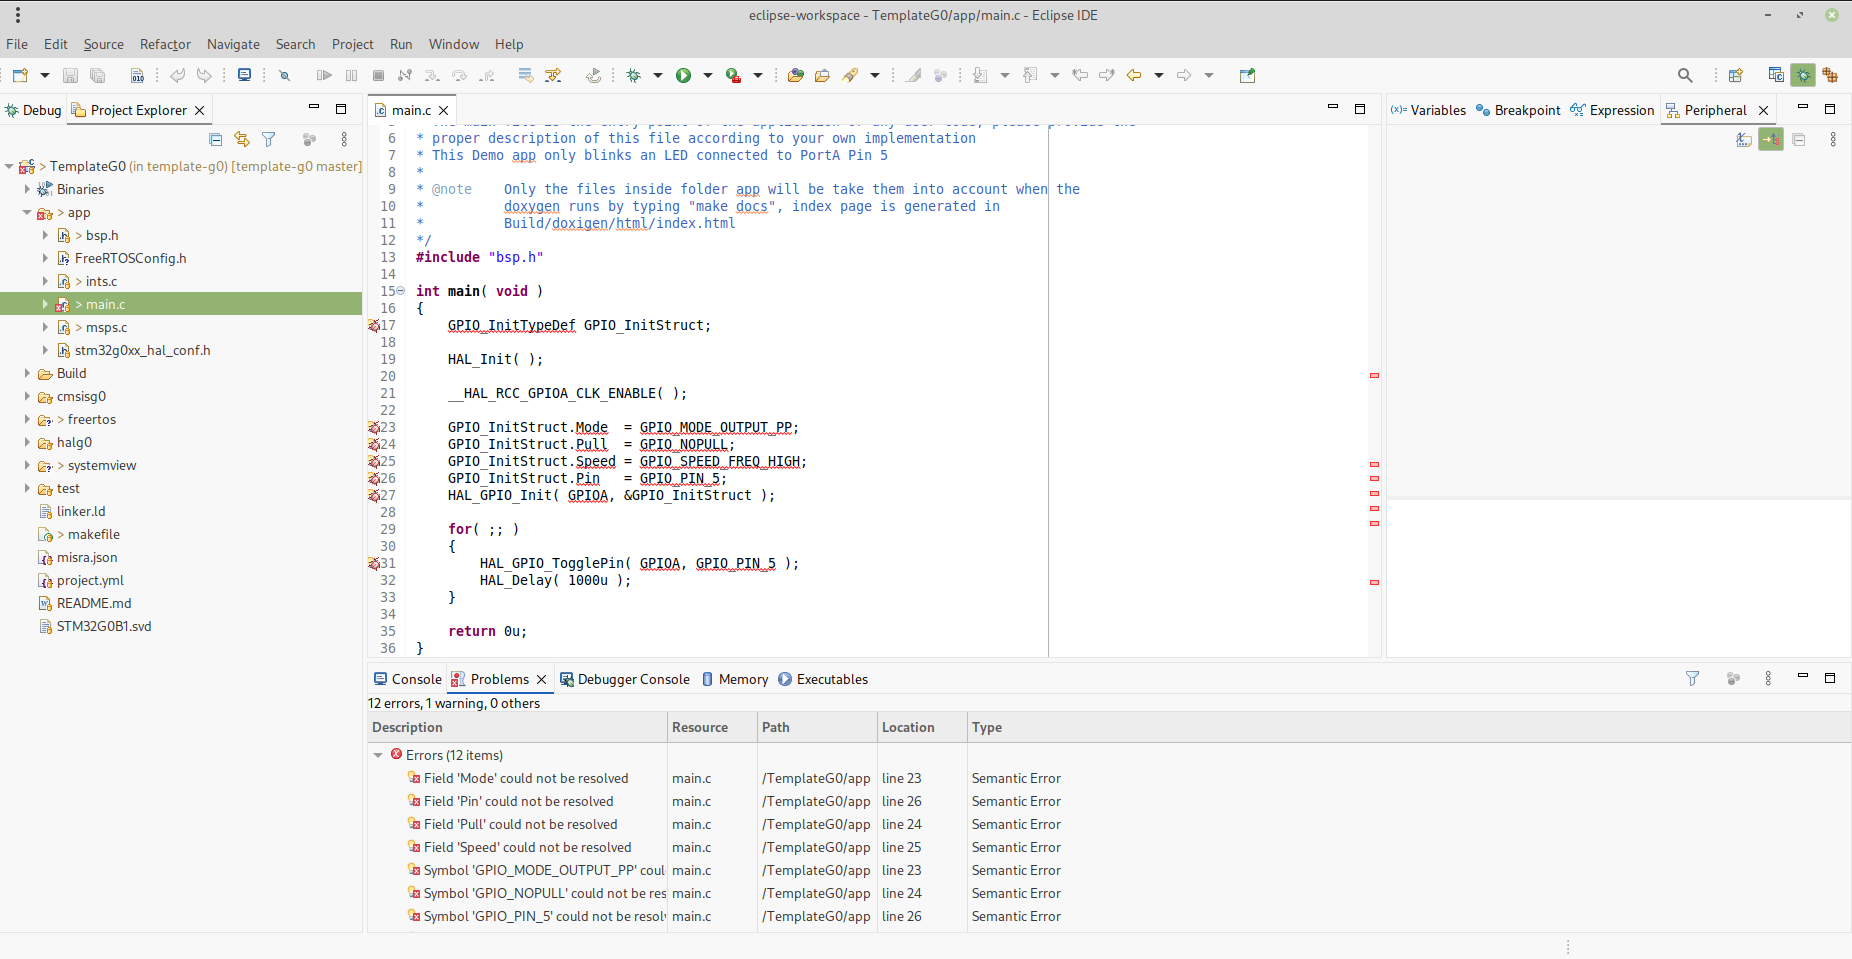
Now your project is open in eclipse, remember we are not planning to build the project with the damn thing, we just want to debug, for that reason lets get rid of those pesky red lines
Got to Menu Window → Preferences and i the new window navigate to C/C++ → Code Analysis un-select all the options. Click in Apply and Close

In Eclipse, you can set what is called Debug Configurations, which allows you to configure options for how and with which tools you plan to debug your code. The embedded version of Eclipse we downloaded comes with plugins to set options for a couple of well-known debug servers, like J-Link and OpenOCD.
Debug with OpenOCD
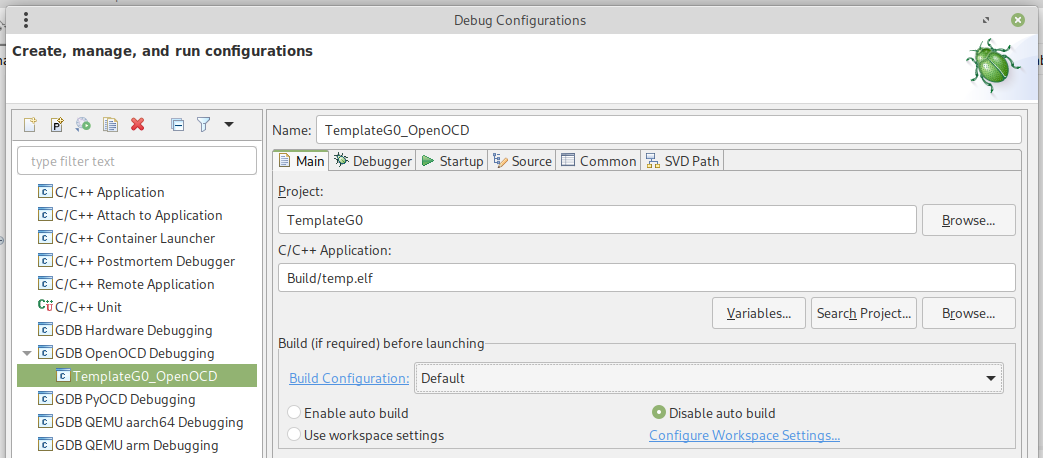
I don't think it's necessary to mention that you need to have the OpenOCD installed on your Linux machine. To create a debug configuration for OpenOCD, go to Menu → Run → Debug Configurations.... In the new window, double-click GDB OpenOCD Debugging. Assign a proper name for your debug configuration (avoid spaces), and set the following options:
- Build Configuration: Default
- Disable Auto Build: Check this option. This is important because, again, we don't want to build anything.
In the same window, go to the Debugger tab. Set the Executable Path to where you have your openocd( try command whereis openocd in your terminal if you are not sure where is located ). Just click on Browse... and navigate to it.
I like to uncheck the Verify Download and Initialize Registers on Start options. Finally, in the GDB Client Setup, make sure you set the correct path to arm-none-eabi-gdb.
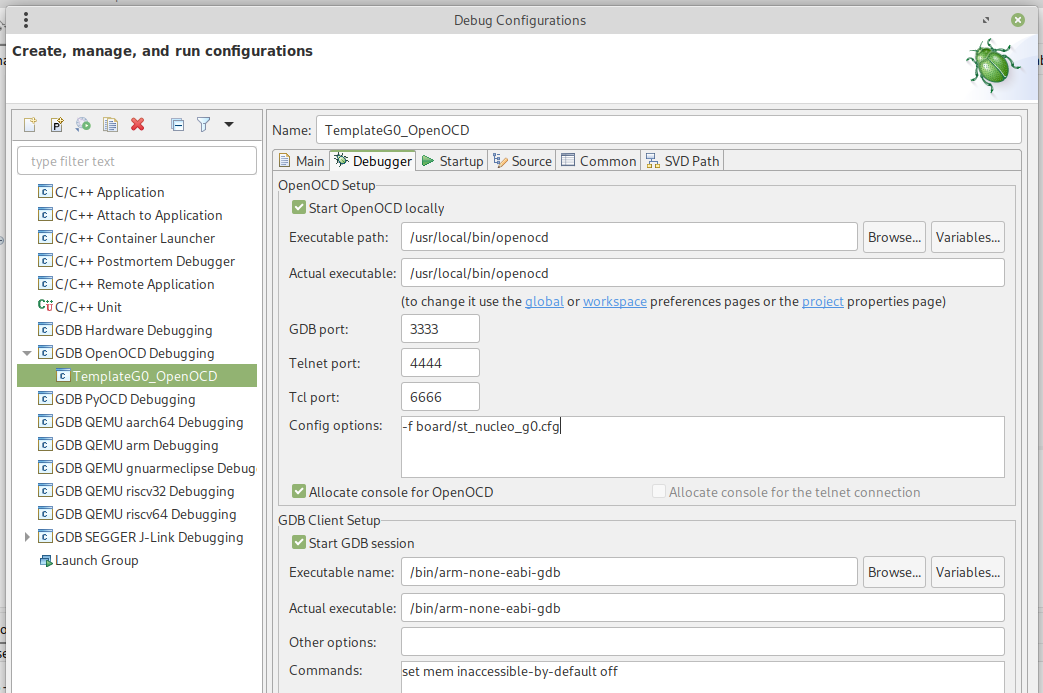
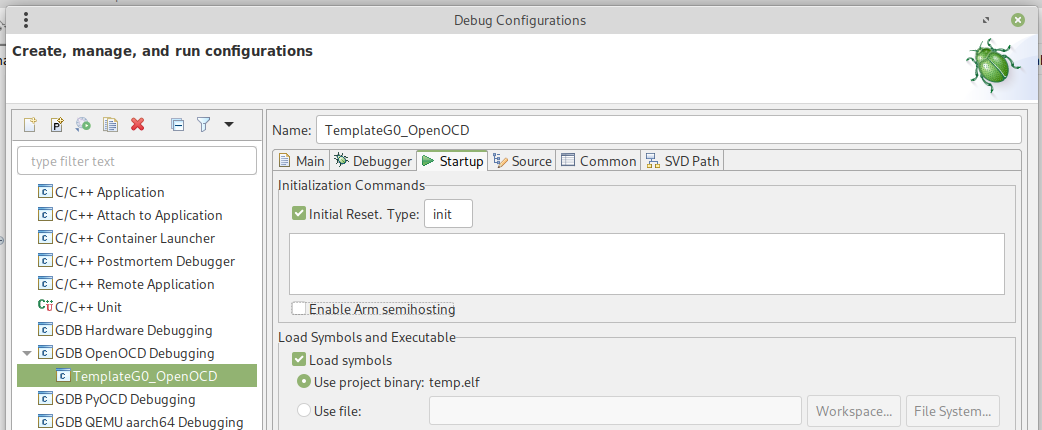
On tab Startup, If your are not going to use semihosting then disable the Enable Arm Semihosting option. You can leave the rest of the options like that or change them if you know what your are doing.
On Common set Shared file, this will make you configuration be saved in your project folder, this way you can reuse it any time you need to debug your project again

Last in SVD Path select the SVD file corresponding to your microcontroller, the file has all the register information you later can use in your debugging session, finally click in Apply and the in Debug

Once in the debug session you will notice ( after a few seconds ) your program ran until the main function and the debug controls in the task menu bar, these are the common ones, like run, stop, reset, step into, etc.. Have fun with your program.
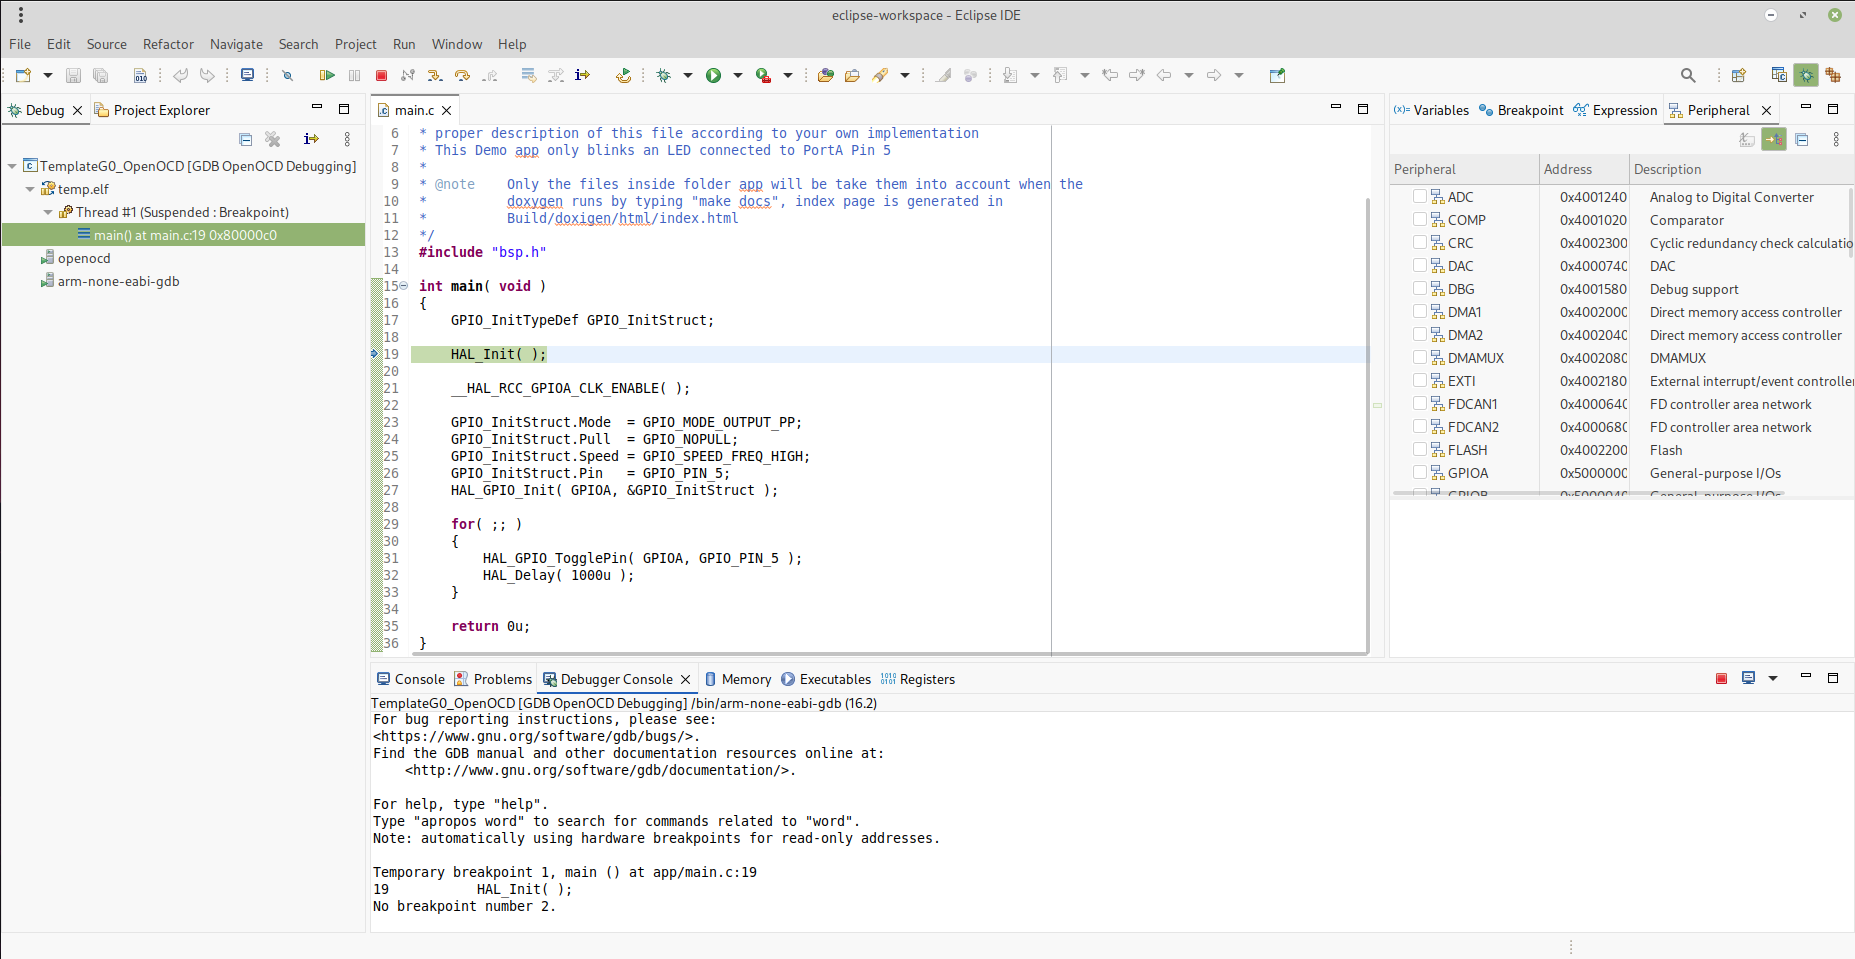
Click on Terminate icon if you want to, well, terminate your debug session. Next time you want to start a debug session go to Run → debug as… → <debug config name> . The options you can set in the debug configuration windows are the same you can set in the openocd command line tool therefore you can find its respective information in the OpenOCD user manual.
Register view
There is something missing: the ability to read and write to the MCU peripheral registers. The reason is that we need something called CMSIS Packages, which we haven't downloaded yet. Don't worry, this is very simple. You just need to change to a different perspective. Go to the menu: Window → Open Perspective → Other…, then select CMSIS Pack and hit Open

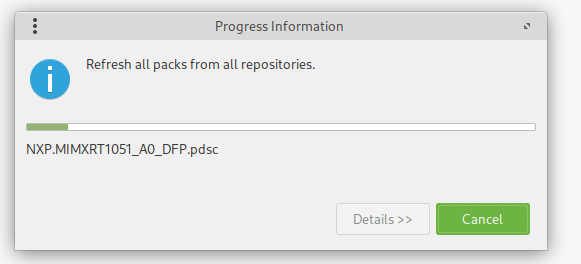
Once the new perspective opens you will find an empty windows, don’t worry, look for the icon Update the CMSIS Pack definitions

This will download the CMSIS packages for all the microcontroller registers from the Keil ARM site, and it may take a moment—or quite a while! If you see a message stating that it cannot find certain files, just click 'Ignore All,' and the download process will continue
Once the previous process ends, star your debug session, then click in the Peripheral windows to select the peripheral you like to display, At the bottom windows look for Memory, where you can find the corresponding peripheral registers and each of its proper bit fields
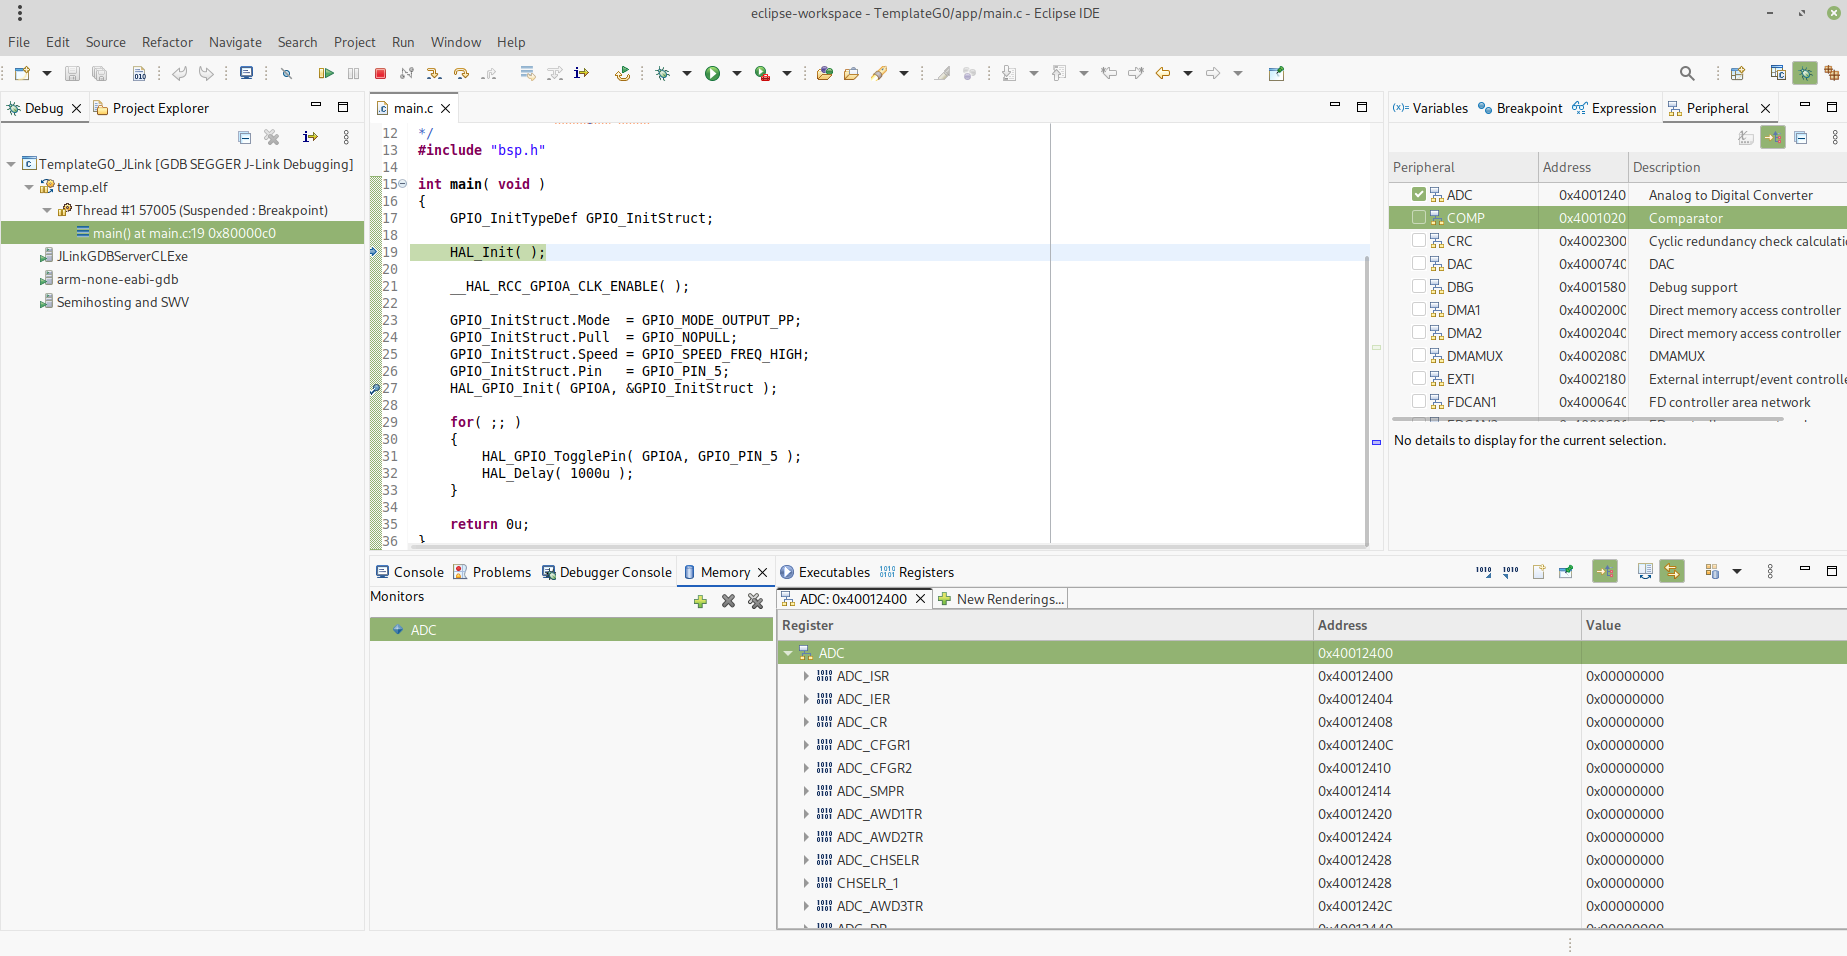
Before we finish please notice there is a new directory and a few extra files created by eclipse, like .cproject, .settings and .project and of course you debug configuration TemplateG0_OpenOCD.launchtake this into account at the moment you version your project usually those files are not part of the official repository of any project, it will be a good idea to make them ignore by your source control tool
.
├── app
├── Build
├── cmsisg0
├── .cproject
├── .gdbinit
├── halg0
├── linker.ld
├── makefile
├── .project
├── .settings
├── STM32G0B1.svd
├── TemplateG0_OpenOCD.launch
└── test
I must confess, I still have some great old memories of this project from back in the days when VSCode didn’t exist. I had no knowledge of build systems like Make, and Eclipse was my favorite tool and the MCU plugin was an indispensable add-on that helped me a lot!
Debug with JLink
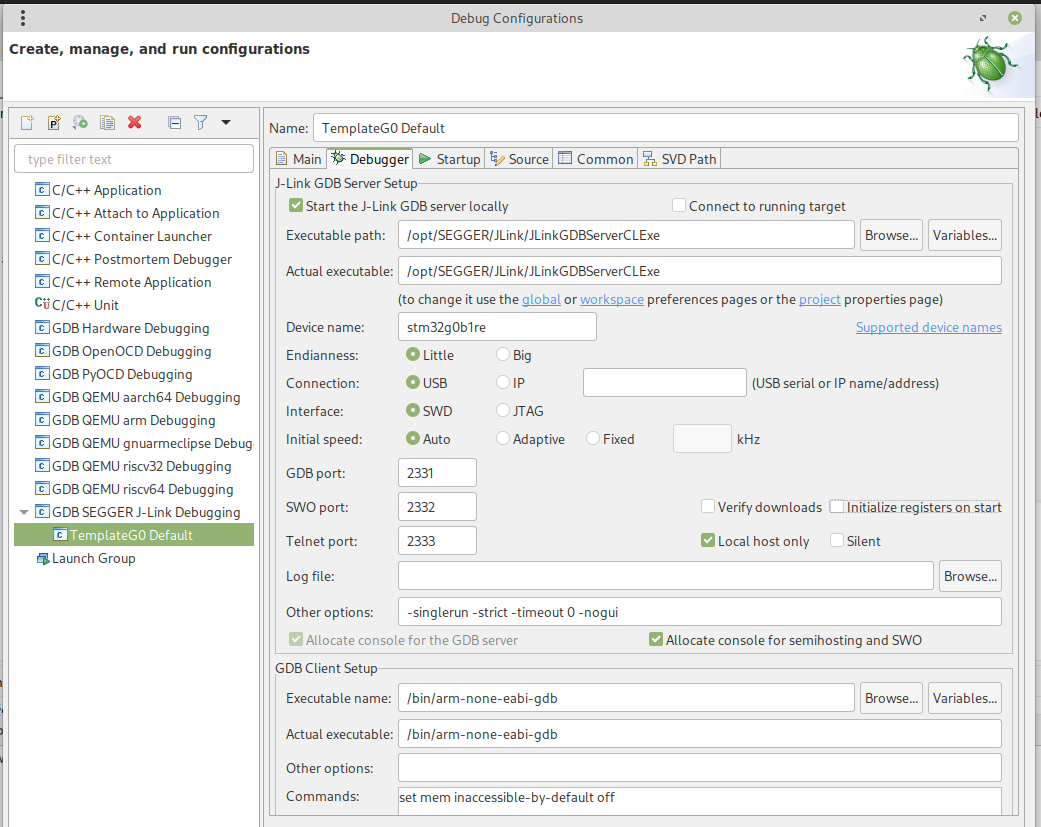
I don't think it's necessary to mention that you need to have the J-Link tools installed on your Linux machine. The configuration is pretty smilar the only setting you need change compared to OpenOCD are in only two tabs
Debugger tab. Set the Executable Path to where you have your JlinkGDBServerCLExe. Just click on Browse... and navigate to it. Change the Initial Speed option to either Auto or Fixed to 4000 KHz. This is the speed at which your J-Link communicates with your target. If you’re using the J-Link from one of your STM32 boards, 4000 kHz is the maximum speed you can set. However, if you’re using an external J-Link, you can set it to higher speeds.
I like to uncheck the Verify Download and Initialize Registers on Start options. Finally, in the GDB Client Setup, make sure you set the correct path to arm-none-eabi-gdb.
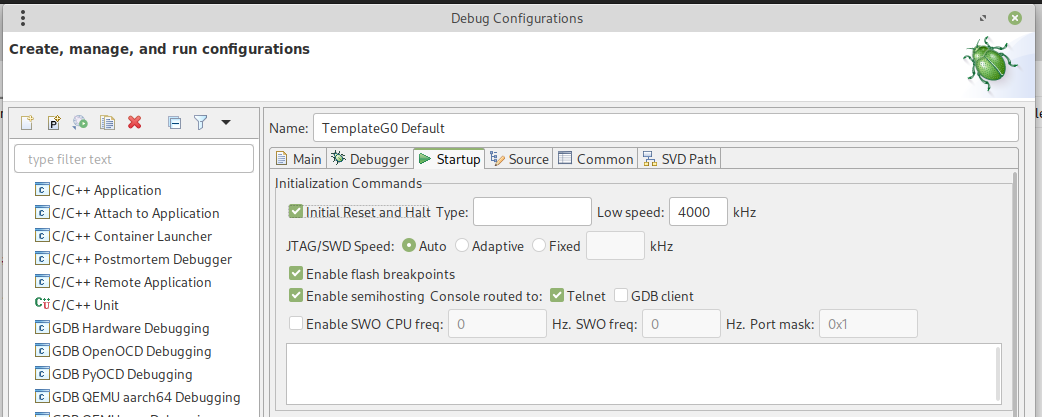
On tab Startup, just remove the option Enable SWO in case your microcontroller does not have support ( the SWO pin is missing in my stm32g0b1 ) and make sure your Lowest Speed is set to 4000 kHz, you can leave the rest of the options like that or change them if you know what your are doing. On Common and SVD Path tabs applies the same configuration we did with OpenOCD
If you want to know more about the configuration option I recommend to read the JLink official user manual.