Segger SystemView is by far one of my favorite tools for embedded development. It allows you to literally visualize your program in real time without the need for an expensive trace device probe. It is really easy to use and, at the same time, flexible enough to be effective when developing and working with complex embedded systems made up of multiple threads and interrupts. Specifically designed for operating systems, it can also be used without one. Let me show you how to instrument your code to be tracked by SystemView.
You can install SystemView using Paru in arch linux with the following command line. Or you can also download form the segger website and install for a different linux distro.
$ paru -S jlink-systemview SystemView makes use of Segger RTT and actually sits on top of it. Using SystemView eliminates the need for a separate RTT setup, which is why I tend to have a single folder for both. I place the source files as shown below, but you can use any directory structure you prefer. Remember, these files are obtained from the SystemView target source files. https://www.segger.com/downloads/systemview
systemview
├── Inc
│   ├── Global.h
│   ├── SEGGER.h
│   ├── SEGGER_RTT_Conf.h
│   ├── SEGGER_RTT.h
│   ├── SEGGER_SYSVIEW_ConfDefaults.h
│   ├── SEGGER_SYSVIEW_Conf.h
│   ├── SEGGER_SYSVIEW.h
│   └── SEGGER_SYSVIEW_Int.h
└── Src
    ├── SEGGER_RTT_ASM_ARMv7M.S
    ├── SEGGER_RTT.c
    ├── SEGGER_RTT_printf.c
    ├── SEGGER_RTT_Syscalls_GCC.c
    ├── SEGGER_SYSVIEW.c
    ├── SEGGER_SYSVIEW_Config_NoOS.c
    └── SEGGER_SYSVIEW_Config_NoOS_CM0.c
Add the following files to be compiled as part of the project in the makefile. If you are using a Cortex-M3, M4, or M7, you also need to add the SEGGER_RTT_ASM_ARMv7M.S file. In my case, as usual, I use the Nucleo G0 board. However, if you are using a board other than the G0 or F0, you need to change SEGGER_SYSVIEW_Config_NoOS_CM0.c to SEGGER_SYSVIEW_Config_NoOS.c.
SRCS += SEGGER_RTT.c SEGGER_RTT_printf.c SEGGER_SYSVIEW.c SEGGER_SYSVIEW_Config_NoOS_CM0.cFor the rest of the article, I’m going to show you how to use Segger SystemView without an operating system, with the goal of teaching you how to instrument your code and make manual setups when needed. If you want to learn how to use SystemView with an actual RTOS like FreeRTOS, refer to the corresponding sections.
Testing Systemview
Let's write a few lines of code to ensure our program can be traced by SystemView. In this example, we will only track when the SysTick interrupt is triggered. Additionally, we will display some messages in SystemView’s own terminal at the moment this occurs.
First, include the necessary header to signal that we are using the library. To make things easier, place the include for the SystemView library in the bsp.h file.
#include <stdint.h>
#include "SEGGER_SYSVIEW.h"
In the ints.c file, locate the SysTick interrupt handler and surround the HAL_Tick() function with special functions to record the interrupt. You will also notice that we are incrementing a special variable. This last step is only necessary when using Cortex-M0 or Cortex-M0+ CPUs.
void SysTick_Handler( void )
{
    /*increment tick global variabel for systemview library
    NOTE: this is only applicable for M0 and M0+ CPUs */
    SEGGER_SYSVIEW_TickCnt++;

    SEGGER_SYSVIEW_RecordEnterISR();
    HAL_IncTick( );
    SEGGER_SYSVIEW_RecordExitISR();
}
In the main function we send a simple message to be displayed by SytemView every 100ms, and of course we initialize the library
int main( void )
{
    uint32_t counter = 0;
    /* Initialize HAL */
    HAL_Init( );
    SEGGER_SYSVIEW_Conf(); // initialize System View

    while(1)
    {
        counter++;
        /*Send a mesage we can view in Ssytemview*/
        SEGGER_SYSVIEW_PrintfHost("Counting counter variable = %03d\r\n", counter);
        HAL_Delay( 100 )
    }

    return 0u;
}
Locate the line below in SEGGER_SYSVIEW_Config_NoOS_CM0.c file and adapt to stm32 microcontrollers RAM base address, pretty much all stm32 families use the same value ( but just in case confirm in its respective datasheet )
// The lowest RAM address used for IDs (pointers)
#define SYSVIEW_RAM_BASE        (0x20000000)
Build the program, open a J-Link connection with make open, and in a secondary terminal, run the program with make debug, just like you did in our previous post. Then, open SystemView using the following command line:
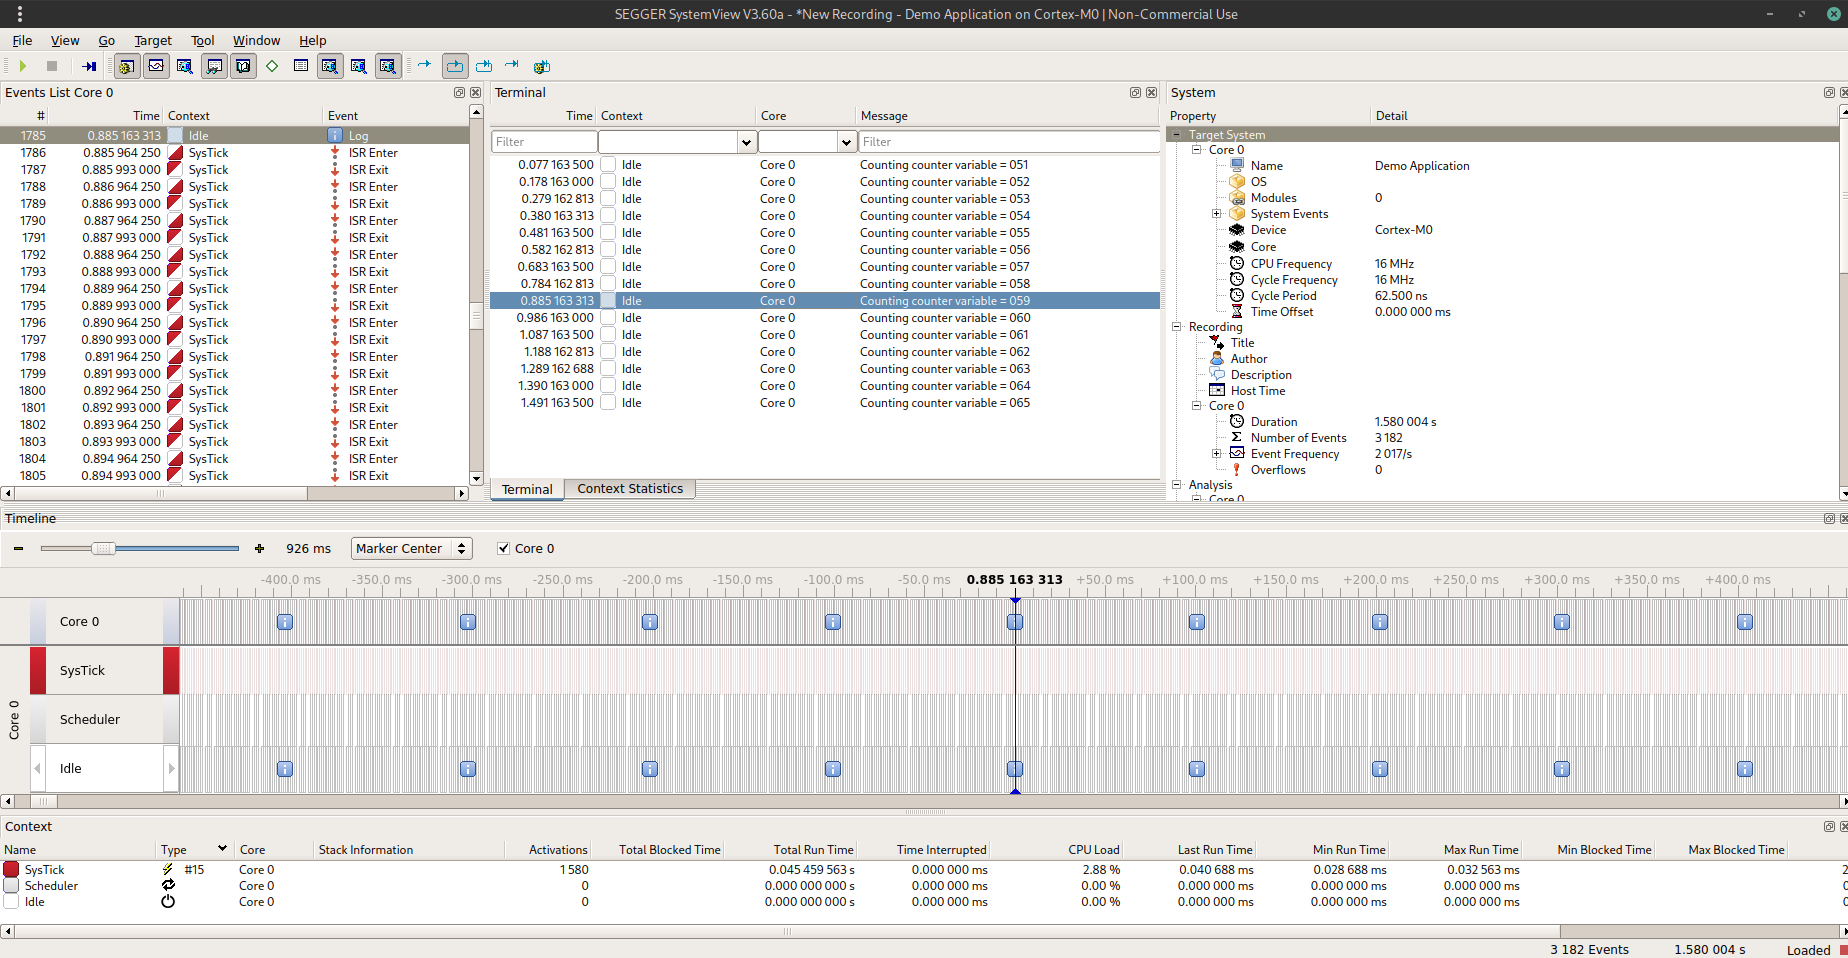
$ SystemView -if SWD -device stm32g0b1re -port 3333Hit the "Start Recording" button, then stop the execution after a few seconds by clicking the "Stop Recording" button. Here's how the SystemView window should look: You can see information such as the messages you're sending in the terminal window, useful system information, recorded events, and a visual representation of your program's execution in the Timeline window.

If you zoom in the Timeline window you can notice when the Tick interrupt is triggered ( each millisecond ) and time is taken to be process, also you can see when the prinf statements are send.

Now that you’ve verified your code can be traced by SystemView, it's a good idea to take a look at the SEGGER_SYSVIEW_Config_NoOS_CM0.c file (or SEGGER_SYSVIEW_Config_NoOS.c if you're not using M0/M0+). Locate the function _cbSendSystemDesc and notice that it calls SEGGER_SYSVIEW_SendSysDesc with parameters that provide information about the SysTick interrupt. This is correct—it sends the interrupt number and its name.
static void _cbSendSystemDesc(void) {
  SEGGER_SYSVIEW_SendSysDesc("N="SYSVIEW_APP_NAME",D="SYSVIEW_DEVICE_NAME);
  SEGGER_SYSVIEW_SendSysDesc("I#15=SysTick");
}
You can add more information if you like, such as details about other interrupts your microcontroller is capable of, or only those your application will use (or instrument with SystemView). For instance, to record the UART2 interrupt (vector number 44), you can find the name and vector number in the startup_stm32g0b1xx.s file or refer to the user manual.
static void _cbSendSystemDesc(void) {
  SEGGER_SYSVIEW_SendSysDesc("N="SYSVIEW_APP_NAME",D="SYSVIEW_DEVICE_NAME);
  SEGGER_SYSVIEW_SendSysDesc("I#15=SysTick");
  SEGGER_SYSVIEW_SendSysDesc("I#44=USART2_LPUART2_IRQHandler");
}
Instrumenting the code
Interrupts are not the only things that can be recorded; we can also do the same with regular functions. Take the following code as an example: it calls a function every 90 milliseconds, and the function takes around 10 milliseconds to run. To do this we must add a couple of systemview library functions , at the beginning, we start recording and stop right before returning. Note that we are using an ID to signal the function. The ID number can range from 32 to 511.
#define APP_EVTID_Function_To_Record     32

void Function_To_Record( void )
{
    SEGGER_SYSVIEW_RecordVoid(APP_EVTID_Function_To_Record);
    static uint32_t counter = 0;
    SEGGER_SYSVIEW_PrintfHost("Counting counter variable = %03d\r\n", counter++);
    HAL_Delay(10);
    SEGGER_SYSVIEW_RecordEndCall(APP_EVTID_Function_To_Record);
}

int main( void )
{
    /* Initialize HAL */
    HAL_Init( );
    SEGGER_SYSVIEW_Conf();            /* Configure and initialize SystemView  */

    while(1)
    {
        /*Send a mesage we can view in Ssytemview*/
        Function_To_Record();
        HAL_Delay(90);
    }

    return 0u;
}
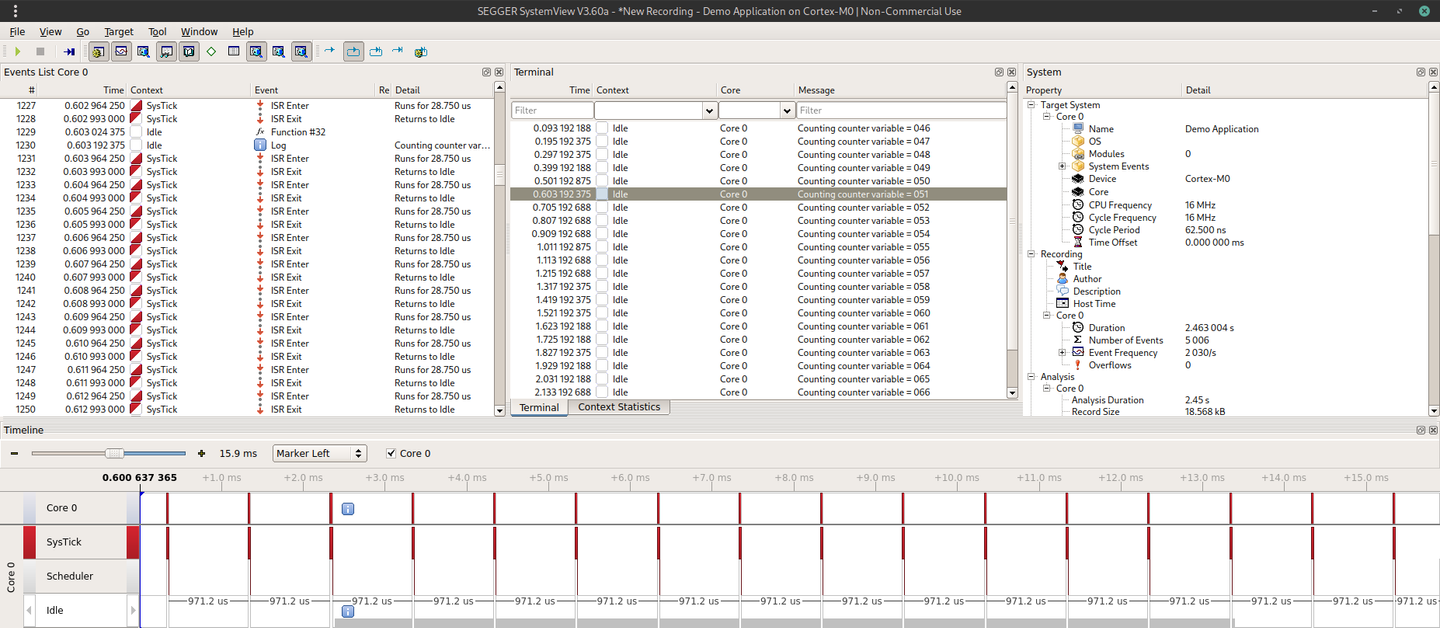
If you build and run the code, then record its execution in SystemView, you will notice that the moment the function is called is marked in gray. You will also see how the SysTick interrupt preempts the function. However, if you look at the Events List window, you will see that Function #32 is being called, but no further details are shown

SystemView is capable of more; it can tell you the function's name and even its parameters. However, we need to provide some information for it to decode properly. To do this, create the following file in the SystemView installation directory ( you will need sudo privileges ).
$ code /opt/SEGGER/SystemView/Description/Demo-NoOS.txtWrite the ID and the name of the functions we want to decode and save the file, an empty line is suggested to avoid problems
32 Function_To_Record
Open the file SEGGER_SYSVIEW_Config_NoOS_CM0.c and define the macro SYSVIEW_OS_NAME with a string that matches the postfix in the name of the description file you created. According to the SEGGER documentation, the string should be equal to <name> in the file name SYSVIEW_<name>.txt.
// The target device name
#define SYSVIEW_DEVICE_NAME     "Cortex-M0"

// The OS name
#define SYSVIEW_OS_NAME         "Demo-NoOS"
...

static void _cbSendSystemDesc(void) {
  SEGGER_SYSVIEW_SendSysDesc("N="SYSVIEW_APP_NAME",D="SYSVIEW_DEVICE_NAME",O="SYSVIEW_OS_NAME);
  SEGGER_SYSVIEW_SendSysDesc("I#15=SysTick");
}
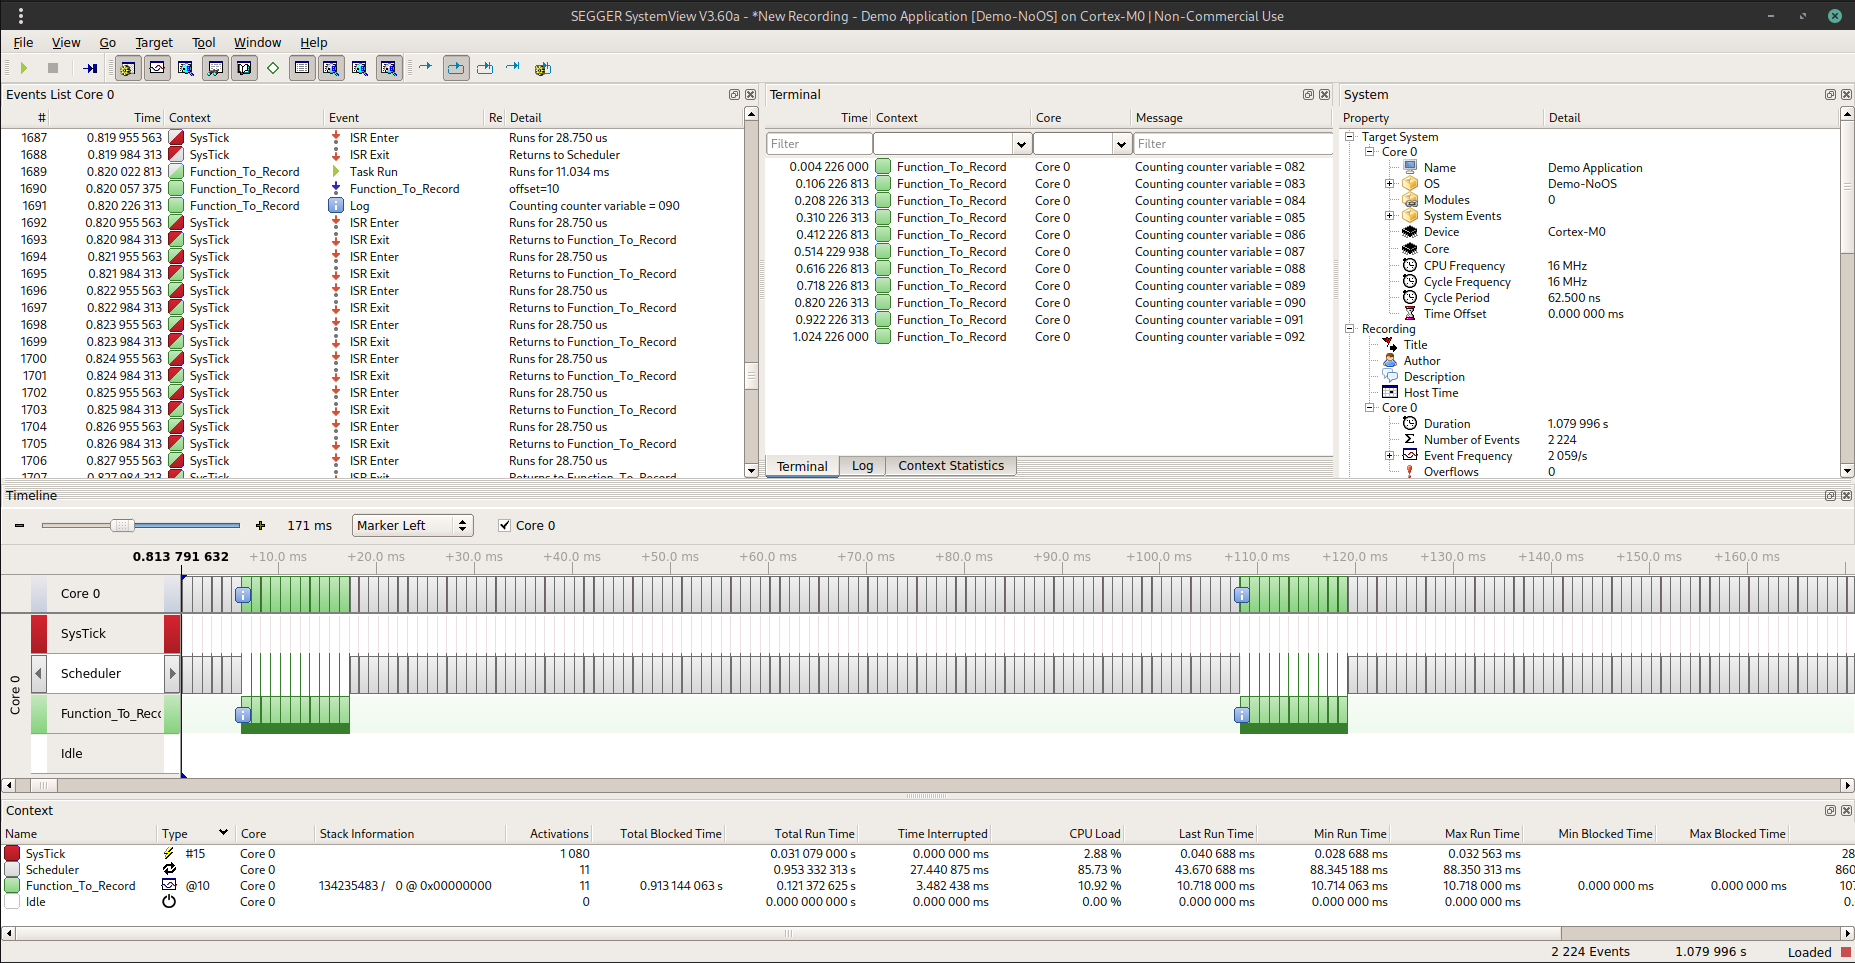
Build and run the program and check in the Events List window how instead of having Function #32 we can see now the function name Function_To_Record

Function Parameters
Modify the function to accept a parameter in the following way, allowing it to pass any number between 0 and 255. Replace SEGGER_SYSVIEW_RecordVoid with SEGGER_SYSVIEW_RecordU32, and as the second parameter, pass the function's parameter. This will instruct SystemView to display the parameter's name.
void Function_To_Record( unsigned char offset )
{
    SEGGER_SYSVIEW_RecordU32(APP_EVTID_Function_To_Record);
    static uint32_t counter = 0;
    SEGGER_SYSVIEW_PrintfHost("Counting counter variable = %03d\r\n", offset + counter++);
    HAL_Delay(10);
    SEGGER_SYSVIEW_RecordEndCall(APP_EVTID_Function_To_Record);
}
Next, we need to modify our description file to indicate the potential parameter offset values. We can declare a NameType and specify that it will be an unsigned number. After the function name, include the parameter name along with the potential values it can represent. In this case, the values would be any integer from 0 to 255.
# Types
NamedType Value   *=%u

# API IDs
32    Function_To_Record    offset=%Value
Now, if you build and run the project again, you will see the function name and the parameter with the value we are passing in the Events List window. In my case, I chose to call the function we're recording like this: Function_To_Record(10);

You can also decode numeric values into strings for a more visual representation of parameters, and you can display returned values as well. Take a look at the SEGGER SystemView official user manual and refer to the section on the OS description file for more information SEGGER SystemView User Guide
Task tracing
We can also visualize the function execution in a much better way. Let's surround our Function_To_Record call with the SEGGER_SYSVIEW_OnTaskStartExec and SEGGER_SYSVIEW_OnTaskStopReady functions from the SystemView library. As parameters, we can set an ID. In this case, we choose the same ID from the previous code but we move the define to SEGGER_SYSVIEW_Conf.h
/*********************************************************************
* TODO: Add your defines here.                                       *
**********************************************************************
*/
#define APP_EVTID_Function_To_Record     32
Then in our main.c file
/*Send a mesage we can view in Ssytemview*/
SEGGER_SYSVIEW_OnTaskStartExec(APP_EVTID_Function_To_Record;
Function_To_Record( 10 );
SEGGER_SYSVIEW_OnTaskStopReady(APP_EVTID_Function_To_Record, 0);
Now we need to 'register' our function in SystemView. We choose to do this in the SEGGER_SYSVIEW_Config_NoOS_CM0.c file. Essentially, the code below uses the library API to register a function and allow the program to trace its execution.
static void SEGGER_SYSVIEW_AddTask(U32 pTask, const char* sName, U32 Prio);

void _cbSendTaskList( void )
{
    SEGGER_SYSVIEW_AddTask( APP_EVTID_Function_To_Record, "Function_To_Record", 10 );
}

static const SEGGER_SYSVIEW_OS_API _NoOSAPI = {(void*)0, _cbSendTaskList};

void SEGGER_SYSVIEW_AddTask(U32 Task, const char* sName, U32 Prio)
{
    SEGGER_SYSVIEW_TASKINFO Info;

    SEGGER_SYSVIEW_OnTaskCreate(Task);

    Info.TaskID = Task;
    Info.sName = sName;
    Info.Prio = Prio;
    Info.StackBase = 0;
    Info.StackSize = 0;
    SEGGER_SYSVIEW_SendTaskInfo(&Info);
}
In the same file, you need to add the NoOSAPI structure we declared earlier as the third parameter in the SEGGER_SYSVIEW_Init function. This is how SystemView knows which function needs to be traced during program execution."
  SEGGER_SYSVIEW_Init(SYSVIEW_TIMESTAMP_FREQ, SYSVIEW_CPU_FREQ,
    &NoOSAPI, _cbSendSystemDesc);
If you build and run the program, you’ll now see a new element, colored green, in the Timeline window, identified by the function name. In reality, it’s the name we assigned to Info.sName = sName; as part of the SEGGER_SYSVIEW_TASKINFO structure. Pretty neat! You can also see in the Context window how SystemView calculates the amount of CPU load shared by the function and the rest of the program (with the main function execution considered as Idle)

Zoom In to see in a more detail our function execution, again see how the tick ISR also preempts both process we currently have

SystemView was specifically designed to track what we call 'Tasks' in operating systems, like embOS or FreeRTOS (examine the SEGGER_SYSVIEW_TASKINFO structure to corroborate what I’m saying). However, a task can be any function dispatched in a periodic fashion—it doesn’t necessarily need to be an RTOS. For example, you can use a simple scheduler. If you're up for a challenge, you can even supercharge the Round Robin Scheduler we’ve provided here